SVD: The Pattern Extraction View
We are starting again from the SVD equation:
X = U*S*Vt
X is n by m
Vt is k by m
On can think of the vectors Vt[i,:] (to use the Python notation) as patterns. Then the SVD is computing those patterns (the matrix Vt) as well as the overlap of points of the dataset (X[i,:]) with the patterns. The coefficients of the overlap (overlap is just a dot product) are available in the vector U[i,:].
For the purposes of this demo, I ran SVD on the MNIST dataset. The MNIST dataset contains images of digits. Below are some of the patterns that SVD extracted. Given the data in MNIST it is not surprising that the first few “patterns” resemble digits.
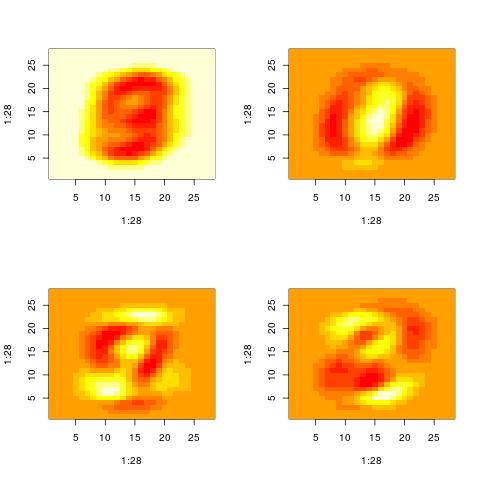
It takes a bit of experience with the MNIST data to interpret the patterns correctly. You can think that the first pattern is 9. However, this is simply the average of all images in the dataset. It turns out that if you average all images of digits of 0 to 9 in MNIST, what you get looks like a 9 (or a 0). The second image which looks like 0 is actually SIMULTANEOUSLY both a 0 and 1. “0” is represented by the red pixels while “1” is represented by the yellow-white pixels. The next two plots look like 3 (yellow) interleaved with 9(red) and 3 (yellow) interleaved with 0(red).
Property 1: A pattern is actually two patterns.
This brings us to the one property of the SVD, namely that the patterns or the vectors Vt[i,:] contain both positive and negative values. The positive values may represent one pattern while the negative can represent another pattern (see above: in the same Vt[i,:] we see simultaneously both a “0” and a “1”).
This property may or may not be desirable. If you want to have “clean patterns” the SVD is not the best technique. Some people will prefer the so called non-negative matrix factorization methods which will restrict the patterns to have only positive values. However, even if you attempt a non-negative matrix factorization, it’s very likely that the aglorithm you use is making use the SVD to find a good starting condition from which to extract the patterns. So the SVD is useful, just needs a refinement.
Property 2: The representation of a data point involves complex cancelations
Looking at patterns Vt[i,:] for high values of i, we actually stop seeing patterns that resemble the original inputs. Maybe one pattern is the union of “3” and a “4”. Then anoth
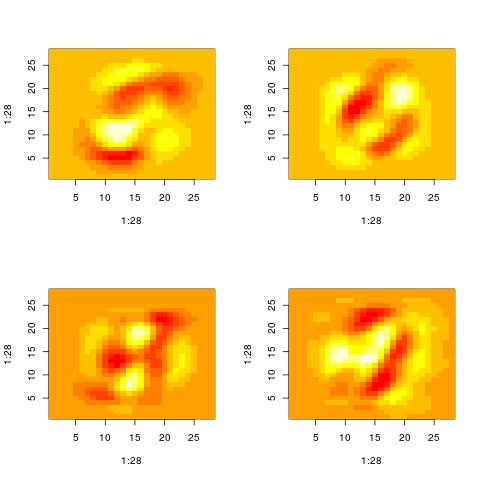
Nevertheless, those patterns are still used to represent the original inputs. The original inputs are just the sum of such patterns appropriately weighted.
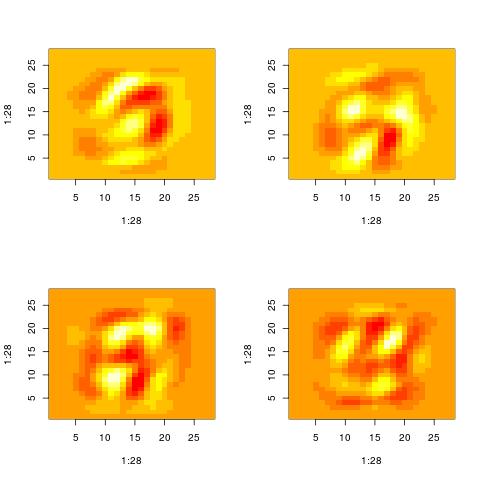
Property 3: SVD is quite aggressive in reducting the variance
One way to think of the SVD is as a way to find a more compact representation of the data. In doing so, the SVD follows (what is equavalent) to a very greedy strategy. First, it finds a dominant pattern in the dataset. Then it just subtracts it from each of the points in the dataset. However, at every iteration the same points are used (without being reweighted). At the end, what will be left from the original inputs will have a lot less structure and may start looking like noise.
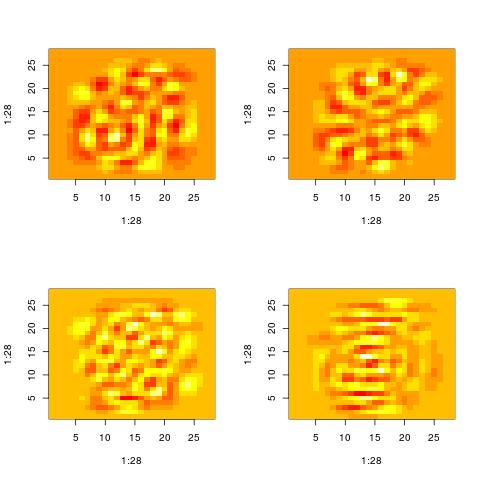
Here are the patterns extracted for i = 60, 70, 80, 90. There is still some structure left. However, you cannot say that the original images were digits. They could have been letters and by looking at those patterns it will be impossible to know.
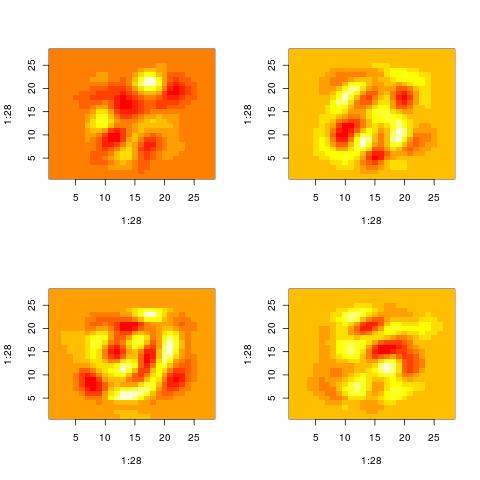
Property 4: high variance directions mask sparse directions
If you are hoping to run the SVD on MNIST (or another dataset) and get out “clean” patterns or clean clusters, it will probably not happen. This is not what the SVD does. However, a repeated application of the SVD might be able to extract some dominant patterns that have high overlap with actual data points. Here is (one variation of) the trick:
X: full dataset
U,s,Vt = svd(X, k = 50) #apply SVD for the first time
take the first left singular vectors (e.g. 10 or 50)
remaining_point_ids = range(0, n)
for each column i in U:
  point_ids = sort the values U[:,i] and extract the point ids corresponding to
      top highest and top lowest
  remaining_point_ids.remove_all(point_ids)

X1 = X[remaining_point_ids,:] #create a new dataset with the remaining point ids
again apply SVD, find points with very high/very low U[:,i] and remove them
The following are some “meaningful patterns” extracted in this way (see the code )
| 0 |  |
 |
 |
 |
 |
 |
 |
 |
 |
 |
|---|---|---|---|---|---|---|---|---|---|---|
| 1 |  |
 |
 |
 |
 |
 |
 |
 |
 |
 |
| 2 |  |
 |
 |
 |
 |
 |
 |
 |
 |
 |
| 3 |  |
 |
 |
 |
 |
 |
 |
 |
 |
 |
| 4 |  |
 |
 |
 |
 |
 |
 |
 |
 |
 |
| 5 |  |
 |
 |
 |
 |
 |
 |
 |
 |
 |
| 6 |  |
 |
 |
 |
 |
 |
 |
 |
 |
 |
| 7 |  |
 |
 |
 |
 |
 |
 |
 |
 |
 |
| 8 |  |
 |
 |
 |
 |
 |
 |
 |
 |
 |
| 9 |  |
 |
 |
 |
 |
 |
 |
 |
 |
 |
(The “0” and “1” look the same, however “0” is the white pixels, while “1” is the black pixels.
The moral is “Don’t give up on the SVD, just apply it a few times.”
There is a publication that applies SVD in a similar fashion: