Making Sense of High Dimensional Big Data via Random Projections
Abstract
It is hard to understand what is hidden in big high dimensional data. However, a moderate number of simple one dimensional projections is enough to answer hard questions about the data via techniques such as visualization, classification and clustering. Random projections have emerged as an extremely effective component of many algorithms for high dimensional data. For example, they are used in the context of nearest neighbor search (via locality sensitive hashing), dimensionality reduction and clustering. The goal of the talk is to give a pleasant journey into the rich area of random projections via many graphical illustrations and intuitive examples. We present how and why random projections work and where they break. We discuss several interesting properties of high dimensional data. For example, why data in high dimensions is likely to look Gaussian when projected in low dimensions; how to spot interesting patterns in high dimensional data by projection into a lower dimension; and how to choose meaningful low dimensional projections.
Buzzwords Talk
Come to the talk that Michael Kleen and I giving at BerlinBuzzwords 2015.
Basic Idea
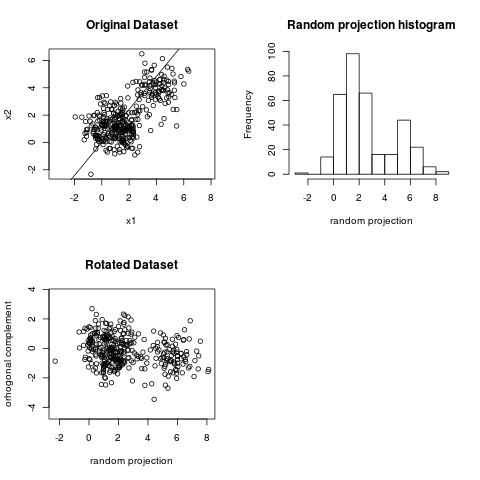
The plot below illustrates one of the basic ideas behind random projections. We will use a two dimensional (2D) space since data in 2D is easy to visualize. If you draw a random line in 2D and project the data on the line, you have a chance to observe some of the structure present in the 2D space. For example, on the plot below we can see two clusters. We drew a random line and in this particular case we got lucky with the choice of of the random line because we can observe the clustering structure on the one dimensional histogram.
A good case for a random projection line: bimodal distribution on histogram
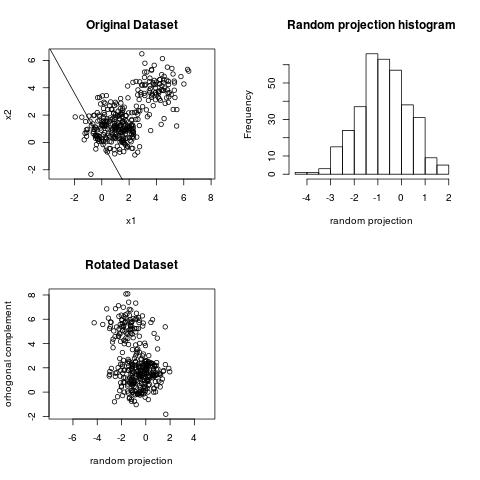
In many cases, however, the histogram of the projection will look like a gaussian distribution and will not reveal any structure. The plot below gives an example of a bad line.
A bad case for a random projection line: Gaussian distribution on histogram
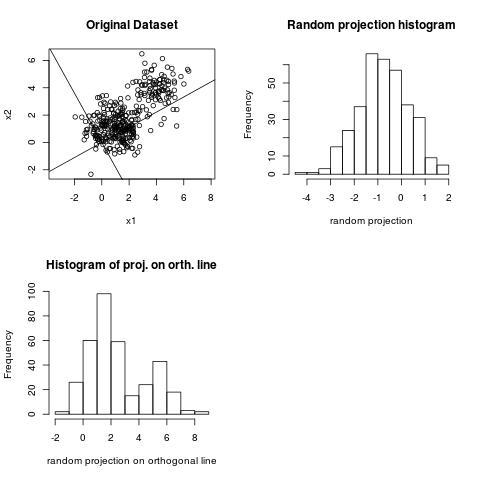
Making the bad case look good, by looking at the orthogonal line
In 2D even the bad case is not really bad, because if we project the data on a line orthogonal to the random line, we will see the clustering structure.
Come to the talk at Berlin Buzzwords 2015
In the talk we will see how the idea of projecting on a few random lines carries over to high dimensions and can be used to solve nearest neighbor search and machine learning problems.
References
A seperate page lists selected references on Random Projections.